
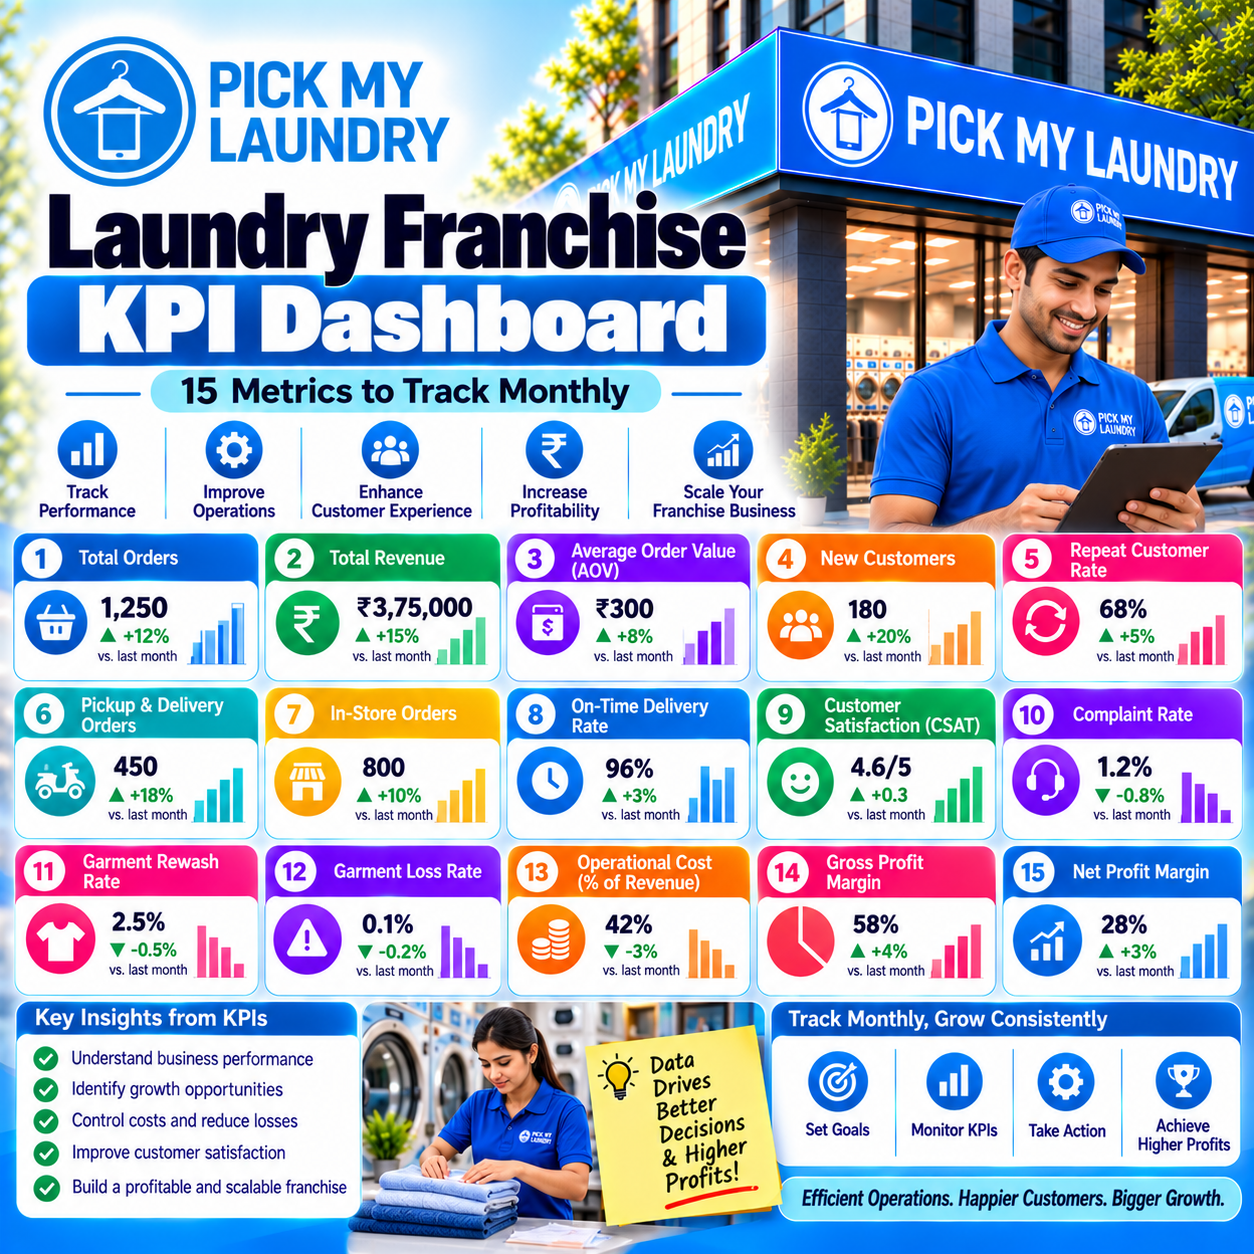
Laundry Franchise KPI Dashboard: 15 Metrics to Track Monthly
Introduction
Running a laundry franchise involves more than managing daily orders and delivering clean garments. To understand whether the business is performing well, owners need to monitor revenue, expenses, customer behaviour, service quality, marketing performance, and cash flow.
Without reliable performance data, it can be difficult to identify why revenue has changed, whether advertising is generating profitable customers, or where operating costs are increasing.
This is where a laundry franchise monthly KPI dashboard becomes valuable.
KPI stands for Key Performance Indicator. A KPI is a measurable metric that helps a business evaluate progress toward a specific goal. A well-designed dashboard brings important figures together so that a franchise owner can review performance and make informed decisions.
For a laundry franchise, useful KPIs cover five major areas:
-
Financial performance
-
Sales and order volume
-
Customer retention
-
Marketing effectiveness
-
Operational quality and efficiency
This guide explains which metrics to track, how to calculate them, and how to use monthly reports to improve business performance.
Pick My Laundry brings 12+ years of industry experience, 500+ stores, a presence in 90+ cities, and operations across 4 countries. Individual franchise performance will depend on factors such as location, investment, operating model, customer demand, costs, and management.
What Is a Laundry Franchise KPI Dashboard?
A KPI dashboard is a structured report that presents important business metrics in one place.
For example, a laundry franchise owner may use a spreadsheet or business management system to track:
-
Total monthly sales
-
Number of completed orders
-
Average order value
-
Operating expenses
-
Contribution margin
-
Repeat customer rate
-
Customer acquisition cost
-
On-time delivery rate
-
Customer complaints
-
Cash available for operations
The purpose is not to collect as many numbers as possible. It is to identify the metrics that help you understand your store's performance and take action when necessary.
A dashboard should be simple enough to review regularly and detailed enough to investigate problems.
15 Important KPIs for a Laundry Franchise
1. Monthly Revenue
Monthly revenue is the total sales generated during a defined month, using a consistent accounting method.
It helps owners understand whether the business is growing, stable, or experiencing a decline.
Formula:
Monthly Revenue = Total Sales Revenue During the Month
Track revenue by service category where possible, such as washing, ironing, dry cleaning, shoe cleaning, or other services offered by your store.
Example:
If a store generates ₹3,00,000 in sales during a month, its reported monthly revenue is ₹3,00,000 before accounting adjustments and expenses.
Compare monthly revenue with previous months and the same period in the previous year where data is available. Consider seasonality, promotions, changes in pricing, and unusual one-time orders before drawing conclusions.
2. Number of Completed Orders
Order volume measures how many orders the store completes within a specific period.
Formula:
Completed Orders = Count of Orders Completed During the Month
This metric helps identify changes in customer demand and operational workload.
If order volume rises while revenue remains flat, the average order value may have decreased. If revenue rises while order volume falls, higher-value orders or pricing changes may explain the difference.
Track received, completed, cancelled, and pending orders separately to avoid confusing demand with completed sales.
3. Average Order Value
Average order value (AOV) measures the average revenue generated per order.
Formula:
Average Order Value = Revenue ÷ Number of Orders
For example, if a store generates ₹3,00,000 from 600 orders:
₹3,00,000 ÷ 600 = ₹500 per order
AOV can help owners understand whether customers are purchasing higher-value services or placing larger orders.
Possible ways to improve AOV include offering relevant service combinations, communicating available services clearly, and creating suitable packages. Any promotion should be evaluated against its effect on margins.
4. Operating Expenses
Revenue alone cannot show whether the store is financially healthy. Owners must also understand how much it costs to operate the business.
Track expenses such as:
-
Rent and maintenance
-
Salaries and wages
-
Utilities
-
Cleaning materials and packaging
-
Equipment maintenance
-
Pickup and delivery
-
Advertising and promotions
-
Software and administrative costs
-
Franchise-related fees, where applicable
Separate recurring expenses from one-time setup costs. Also distinguish fixed expenses from variable costs to understand how expenses change as order volume increases.
5. Contribution Margin
Contribution margin indicates how much revenue remains after the variable costs associated with delivering the services have been deducted.
Formula:
Contribution Margin = Revenue − Variable Costs
Contribution Margin Percentage:
\[ \text{Contribution Margin \%} = \frac{\text{Revenue} - \text{Variable Costs}}{\text{Revenue}} \times 100 \]
For example, if revenue is ₹3,00,000 and applicable variable costs are ₹1,50,000, the contribution is ₹1,50,000, or 50%.
This is an illustrative calculation, not a benchmark for a laundry franchise.
Contribution is not the same as net profit. Rent, fixed salaries, depreciation, financing costs, taxes, and other expenses may still need to be deducted depending on how the calculation is defined.
6. Net Profit Margin
Net profit margin helps owners understand how much of the business's revenue remains as net profit after the relevant expenses are accounted for.
Formula:
Net Profit Margin = (Net Profit ÷ Revenue) × 100
The calculation should follow a consistent accounting definition. Specify whether interest, taxes, depreciation, and other expenses are included.
A rising revenue figure does not necessarily mean profitability is improving. Costs may be increasing at a faster rate than sales.
7. Customer Acquisition Cost
Customer Acquisition Cost (CAC) measures the cost of acquiring a new customer.
Formula:
CAC = Attributable Acquisition Expenses ÷ Number of New Customers Acquired
Suppose a store spends ₹12,000 on a defined marketing campaign and acquires 40 new customers attributable to that campaign.
₹12,000 ÷ 40 = ₹300 per acquired customer
Use a clear attribution method and include the costs relevant to the channel being evaluated. If you include only advertising spend, label the metric accordingly rather than presenting it as a fully loaded acquisition cost.
Compare CAC with customer lifetime contribution, not just lifetime revenue, to better understand whether customer acquisition is economically sustainable.
8. Repeat Customer Rate
Repeat customer rate measures the share of customers who place more than one order during a defined measurement period.
A simple cohort-based formula is:
Repeat Customer Rate = Customers Who Ordered Again ÷ Eligible Customers in the Cohort × 100
For example, if 80 out of 200 customers in a defined customer cohort place another order during the measurement window, the repeat rate is 40%.
Define the cohort and period consistently. Customers who use occasional dry cleaning services may have different ordering patterns from customers who use weekly washing services.
9. Customer Retention Rate
Customer retention measures the proportion of existing customers who remain active over a specified period.
A common formula is:
\[ \text{Retention Rate} = \frac{E-N}{S} \times 100 \]
Where:
-
\(E\) = customers at the end of the period
-
\(N\) = new customers acquired during the period
-
\(S\) = customers at the start of the period
For example, a store starts with 200 customers, ends with 220, and acquires 60 new customers during the period.
Retention = (220 − 60) ÷ 200 × 100 = 80%
This calculation assumes the customer counts use a consistent definition of active customer and period.
10. Marketing Return on Investment
Marketing ROI helps evaluate whether a campaign creates sufficient financial value relative to its cost.
A useful formula is:
\[ \text{Marketing ROI} = \frac{\text{Incremental Contribution} - \text{Marketing Cost}} {\text{Marketing Cost}} \times 100 \]
For example, if a campaign generates ₹30,000 in attributable incremental contribution before marketing costs and costs ₹10,000 to run:
ROI = (₹30,000 − ₹10,000) ÷ ₹10,000 × 100 = 200%
Use incremental contribution rather than total revenue whenever possible. Attribute results carefully and account for discounts, repeat purchases, and other costs that affect the campaign's actual value.
11. On-Time Order Completion Rate
Customers expect their garments to be ready within the agreed timeframe.
Formula:
On-Time Completion Rate = Orders Completed on Time ÷ Orders Due During the Period × 100
Track the original agreed deadline and document any approved changes.
If the rate declines, investigate possible causes such as staff shortages, processing delays, equipment downtime, inaccurate promises, or pickup and delivery issues.
12. Rework Rate
Rework rate measures how often completed orders require additional processing because the original result did not meet the required standard.
Formula:
Rework Rate = Orders Requiring Rework ÷ Completed Orders × 100
A high or rising rate may indicate inconsistent processing, unclear customer instructions, quality-control gaps, or training needs.
Not every rework case has the same cause. Record the reason for each case to identify recurring problems rather than treating the percentage as the complete explanation.
13. Complaint Rate
Complaint rate helps owners understand the frequency of reported customer issues.
One practical formula is:
Complaint Rate = Orders With a Complaint ÷ Completed Orders × 100
Record complaint categories such as turnaround delays, billing issues, garment damage concerns, missing items, and communication problems.
The objective is not merely to reduce the number of complaints recorded. Encourage customers to report genuine problems and focus on resolving the causes.
14. Average Order Turnaround Time
Turnaround time measures how long it takes to complete an order from a defined starting point to completion.
Formula:
Average Turnaround Time = Total Elapsed Time for Completed Orders ÷ Number of Completed Orders
Define whether the clock starts at order acceptance, garment collection, or processing start. Use the same definition for every reporting period.
Track median turnaround time alongside the average when a small number of unusually delayed orders could distort the overall figure.
15. Cash Flow and Available Working Capital
Cash flow indicates the movement of money into and out of the business. It is important because a store may report revenue but still experience difficulty paying operating expenses on time.
Track:
-
Customer payments received
-
Supplier payments
-
Salaries and rent
-
Utilities and other operating expenses
-
Equipment maintenance payments
-
Loan repayments, where applicable
-
Outstanding customer or business receivables
-
Cash available for upcoming obligations
Review the expected cash position over the coming weeks, not just the balance at month-end.
Example: Monthly Laundry Franchise KPI Dashboard
The following example shows how a simple monthly report might look. These figures are illustrative and are not Pick My Laundry performance benchmarks.
|
KPI |
Example Result |
|---|---|
|
Monthly revenue |
₹3,00,000 |
|
Completed orders |
600 |
|
Average order value |
₹500 |
|
Variable costs |
₹1,50,000 |
|
Contribution |
₹1,50,000 |
|
Contribution margin |
50% |
|
Marketing expenditure |
₹12,000 |
|
New customers attributed to marketing |
40 |
|
Campaign acquisition cost |
₹300 |
|
On-time completion rate |
92% |
|
Rework rate |
3% |
|
Customer complaint rate |
2% |
The table is useful only when the definitions are consistent. For example, the marketing acquisition cost uses the stated campaign expenditure, and the operational rates depend on the relevant orders included in each calculation.
What should the owner investigate?
-
Revenue: Compare with previous months and expected demand.
-
Average order value: Identify changes in service mix, pricing, and promotions.
-
Contribution margin: Investigate increases in variable costs.
-
Acquisition cost: Check whether new customers return and generate sufficient contribution.
-
On-time completion: Identify bottlenecks in processing or delivery.
-
Rework and complaints: Examine root causes and implement corrective actions.
Avoid making major business decisions based on one month's results alone. Compare multiple periods and account for seasonality and unusual events.
How to Build a Monthly KPI Dashboard
Step 1: Choose a Consistent Reporting Period
Use the same monthly start and end dates for revenue, costs, customer activity, and operational metrics.
Where customer retention or marketing attribution requires a longer measurement window, record that window separately.
Step 2: Collect Data From Reliable Sources
Possible sources include:
-
Billing and point-of-sale systems
-
Order management software
-
Accounting records
-
Payment statements
-
Advertising platforms
-
Customer relationship management systems
-
Customer complaint logs
-
Delivery and processing records
Reconcile the figures before reporting them. Inconsistent order IDs or customer records can lead to misleading results.
Step 3: Define Each KPI
Write down the formula, data source, reporting period, and responsible person for every metric.
For example, define whether cancelled orders are excluded from completed orders and whether a customer counts as new after a particular period of inactivity.
Step 4: Compare Actual Results With Targets
Set targets based on the store's own financial plan, operating capacity, historical data, and market conditions.
Do not adopt an industry benchmark without checking whether it applies to your franchise model and service mix.
Step 5: Identify the Biggest Variances
Focus on the most significant changes instead of investigating every small fluctuation.
If revenue rises but contribution falls, investigate costs and pricing. If customer acquisition increases but repeat bookings decline, investigate customer experience and acquisition quality.
Step 6: Assign Corrective Actions
Each major issue should have:
-
A clear description
-
A responsible person
-
A corrective action
-
A deadline
-
A follow-up measurement
This turns a dashboard into a management tool rather than a report that is simply reviewed and forgotten.
How Often Should Laundry Franchise Owners Review KPIs?
Different metrics require different review frequencies.
|
Frequency |
Metrics to Review |
|---|---|
|
Daily |
Orders, payments, pending orders, complaints, urgent delays |
|
Weekly |
Revenue trends, order volume, marketing leads, quality issues |
|
Monthly |
Profitability, contribution margin, CAC, retention, cash flow |
|
Quarterly |
Pricing, service mix, marketing strategy, investment decisions |
Daily monitoring is useful for operational issues, while monthly reporting provides a broader financial picture.
The appropriate frequency also depends on the store's size, technology, order volume, and management structure.
Common KPI Dashboard Mistakes
Tracking Too Many Metrics
A dashboard crowded with dozens of indicators can make it harder to identify the most important problems. Start with a manageable set linked to business goals.
Confusing Revenue With Profit
Sales growth is not enough. Track variable costs, fixed expenses, and profitability using clear definitions.
Using Inconsistent Formulas
Comparisons become unreliable if the definition of a completed order, active customer, or marketing cost changes between months.
Ignoring Customer Feedback
Quantitative metrics may show that complaints are increasing but not explain why. Review complaint categories and customer feedback to understand the underlying causes.
Reacting to Short-Term Changes Too Quickly
A single month may be affected by holidays, weather, local events, promotions, or operational disruptions. Look for meaningful trends before making major changes.
Failing to Assign Ownership
Every important metric should have someone responsible for checking its accuracy and addressing significant changes.
How Pick My Laundry Franchise Owners Can Use KPI Reporting
A franchise owner can use KPI reporting to understand local store performance and identify opportunities to improve operations.
Depending on the franchise model and available systems, reporting may help with:
-
Monitoring sales and order patterns
-
Reviewing customer service quality
-
Evaluating local marketing campaigns
-
Identifying cost increases
-
Tracking order completion and rework
-
Planning staffing and supply requirements
-
Improving customer retention
Before opening a franchise, prospective partners should ask what reporting tools, training, operating procedures, and performance support are included in the applicable franchise arrangement.
Pick My Laundry's brand experience and network provide context for evaluating the opportunity, but each store's performance should be assessed using its own actual financial and operational data.
Frequently Asked Questions (FAQs)
1. What is a KPI dashboard for a laundry franchise?
It is a report that brings together important business measures, such as revenue, order volume, expenses, customer retention, marketing performance, and service quality, to help owners monitor performance.
2. Which KPIs should a laundry franchise owner track first?
Start with monthly revenue, completed orders, average order value, operating expenses, contribution margin, cash flow, customer complaints, and on-time completion rate. Add more detailed metrics as reliable data becomes available.
3. Can I manage a laundry franchise KPI dashboard in Excel?
Yes. A spreadsheet can be sufficient for a single outlet if the data is recorded consistently. Larger operations may benefit from integrated billing, order management, accounting, and reporting systems.
4. How do I calculate laundry business profit margin?
Divide the relevant profit measure by revenue and multiply by 100. Specify whether you are calculating contribution margin, operating margin, or net profit margin, because each uses a different cost definition.
5. How can I measure whether laundry advertising is working?
Track campaign spending, attributable new customers, conversion rates, and incremental contribution. Where possible, measure repeat purchases and customer lifetime contribution rather than judging success only by leads or initial revenue.
6. Why should a laundry business monitor repeat customers?
Repeat customer data helps owners understand whether customers continue using the service. It can inform decisions about service quality, loyalty programmes, customer communication, and marketing allocation.
7. What is a good monthly revenue target for a laundry franchise?
There is no universal target. Revenue depends on location, service range, pricing, capacity, operating model, competition, and customer demand. Use a realistic financial forecast and update it using actual performance.
Conclusion
A monthly KPI dashboard gives laundry franchise owners a clearer view of business performance. By tracking financial results, order volume, customer behaviour, marketing effectiveness, and service quality, owners can identify problems earlier and make better-informed decisions.
The most useful dashboard is not necessarily the most complicated one. It is the one built on reliable data, consistent definitions, and clear actions.
Start with a few important metrics, review them regularly, investigate meaningful changes, and use the findings to improve customer experience and operational performance.
Explore the Pick My Laundry franchise opportunity to learn more about its business model, investment requirements, and applicable support.
Website: https://pickmylaundry.in
Internal Linking Suggestions
Add contextual links to these related Pick My Laundry blogs:
-
Laundry Franchise Unit Economics: Revenue, Costs, Margins & ROI Explained — link from the financial KPI section.
-
Laundry Franchise Customer Acquisition Cost: How to Measure Marketing ROI — link from customer acquisition and marketing performance.
-
Laundry Franchise Customer Lifetime Value: Why Repeat Customers Matter — link from customer retention.
-
Laundry Franchise Cash Flow Management: A Practical Guide for Store Owners — link from the cash flow section.
-
Laundry Franchise Complaint Management: SOPs for Handling Customer Issues — link from complaint tracking and service quality.
Use the correct published URLs when adding these internal links.